C# Code Quality - Part 1

Improving a codebase can be a difficult task. The larger the codebase, the more difficult it becomes to find and fix poor code manually. When confronted with a new codebase, metrics are needed to determine what needs to be improved. This article discusses some tools to get the metrics, and the series discusses how to use the information to make targeted refactors.
A codebase is the heart of a software business. When it is too complicated, the business suffers. Features become more time consuming and risky to implement, and bugs occur more frequently. The cost of training new staff is also higher because it takes them longer to understand what the code does. Finding ways to improve code quality is imperative for business. It’s best to consider code quality early, but frequently it is only an afterthought. Poorly written codebases can, however, be cleaned up over time.
Imagine you are given three hours to clean a small apartment. It doesn’t have to be spotless, but the average cleanliness of the rooms needs to be improved. It’s possible to see the problem areas with the naked eye, and there is enough time to walk around to address them. Now imagine you have the same task, but for a 50 story office building. Firstly, you wouldn’t be able to see all the mess without special tools, and even if you could, you wouldn’t have enough time to travel to all the problem areas. Small codebases are like apartments. It’s possible to keep them in order without tools. Large codebases are like office buildings. Metrics are needed to target problematic areas, and mass refactor tools are needed to address those issues in bulk.
Code analysis and metrics are the starting point for improving a codebase. Code is data, and tools can analyze it like all other kinds of data. Visual Studio Professional has not traditionally come with excellent tooling in this department, so 3rd party tools are necessary. What we need to know is: how much code is there? Is it following our coding standards? Where are the most error-prone areas of the code? Which parts of the code are too complicated? Is it unit testable? And, so on.
In previous articles, I wrote about FxCop. It is an excellent free tool that helps to identify problematic code. I recommend using FxCop to stop your codebase from degrading over time. It also comes with excellent tooling for refactoring problematic code in bulk. I strongly recommend reading C# Code Rules Part 1 as a supplement to this article, but what FxCop lacks is visual tools for counting and categorizing the types of problems that are most commonly occurring in the codebase, and targeting problem areas. Ultimately, paid tools work best in conjunction with FxCop.
Two paid tools that I’ve used to analyze code are Resharper / Rider, and NDepend. They both contain an in-depth array of analyzers and visual categorization tools to show you what is wrong with the code and how to target it.
Resharper / Rider
JetBrains is a leader in the refactoring and code analysis space. Resharper helps you find problematic code and rectify it quickly while Rider is a full-fledged C# IDE that has the same functionality. Resharper is the most popular C# refactoring tool, and it also analyses HTML, XAML, JavaScript, and more.
This code inspection tool is a direct way to get metrics on problematic code. You can scan a single project or a full solution. It is useful because it helps to identify patterns in the codebase. For example, it might mean that the team doesn’t know about certain C# features, or they may not know that they are making common mistakes again and again.
The downside of Resharper is that it bloats the IDE with menu items, and can disrupt the typical Visual Studio experience. I find myself turning it off when I am not refactoring and only using it when it’s time to clean the code up. Some people like the Resharper interface, and for those people, I recommend looking at Rider. If you buy a Rider license, you get Resharper for free.
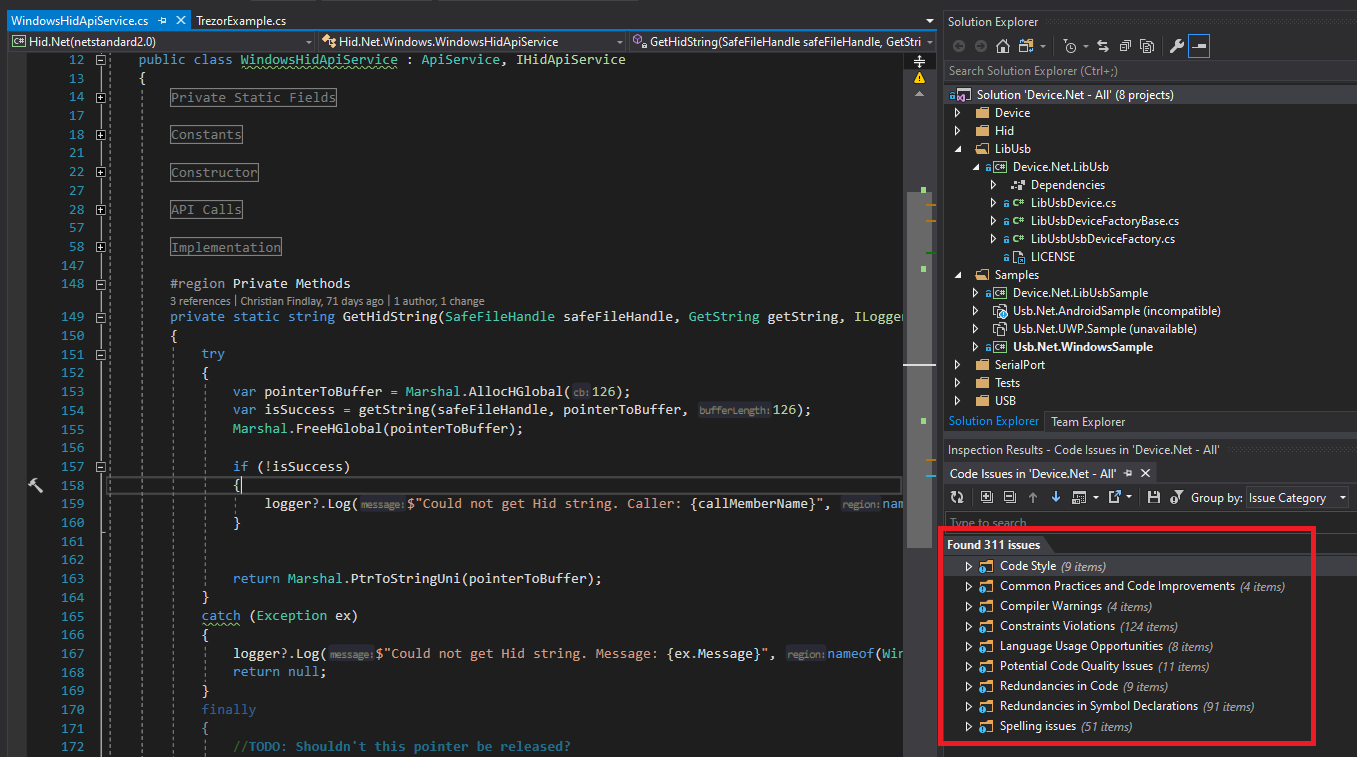
Resharper divides code rules up into self-explanatory categories. For example, it is straightforward to see redundant code for deletion.
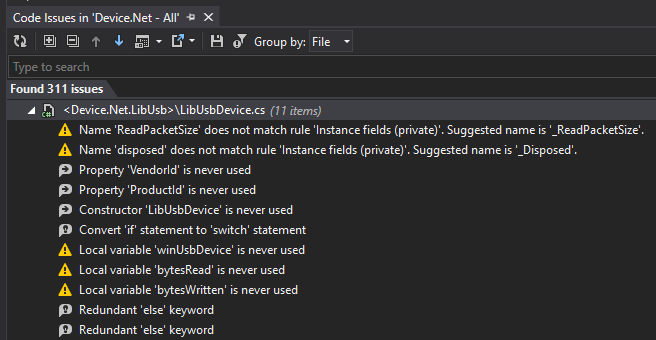
It has excellent tooling for fixing problems across a whole solution.

It also allows you to view the issues in different ways. For example, you get a view of issues in a single file.
NDepend

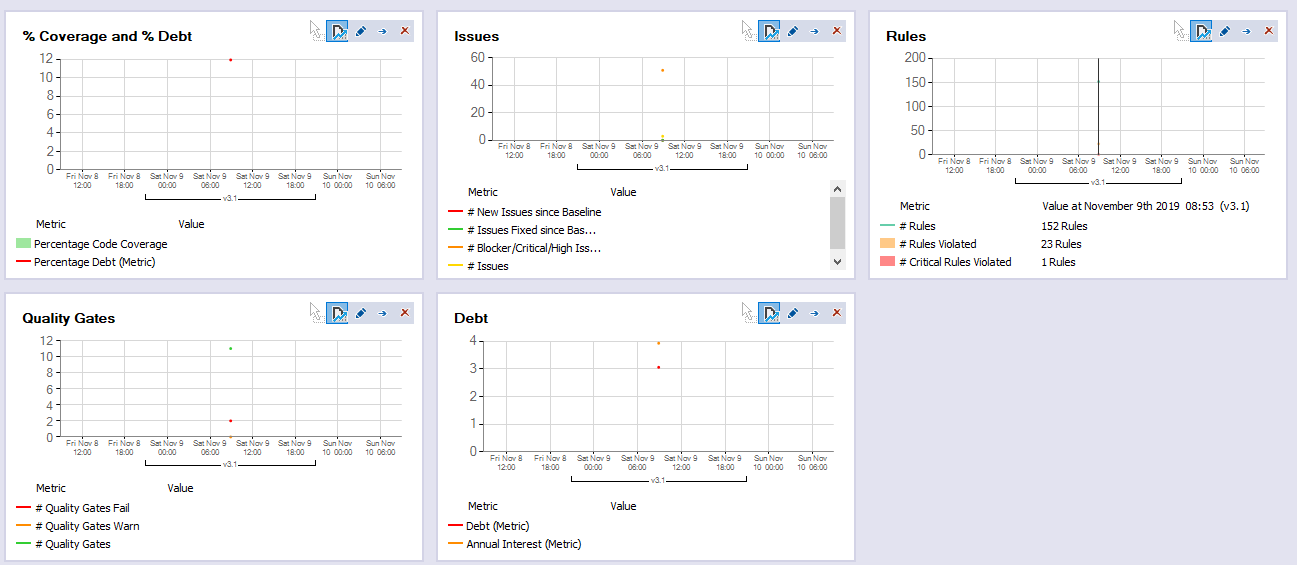
NDepend is a code analysis powerhouse. It has similar functionality to Resharper in that it can count and categorize code rule violations, but has more high-level tools. It comes with a dashboard that does things like rate your codebase. It can be used as a standalone app, or it can be used as a Visual Studio Extension. It also integrates with a raft of other tools to provide more information. For example, it can integrate with unit testing coverage tools like dotCover to include how much code has been unit tested.
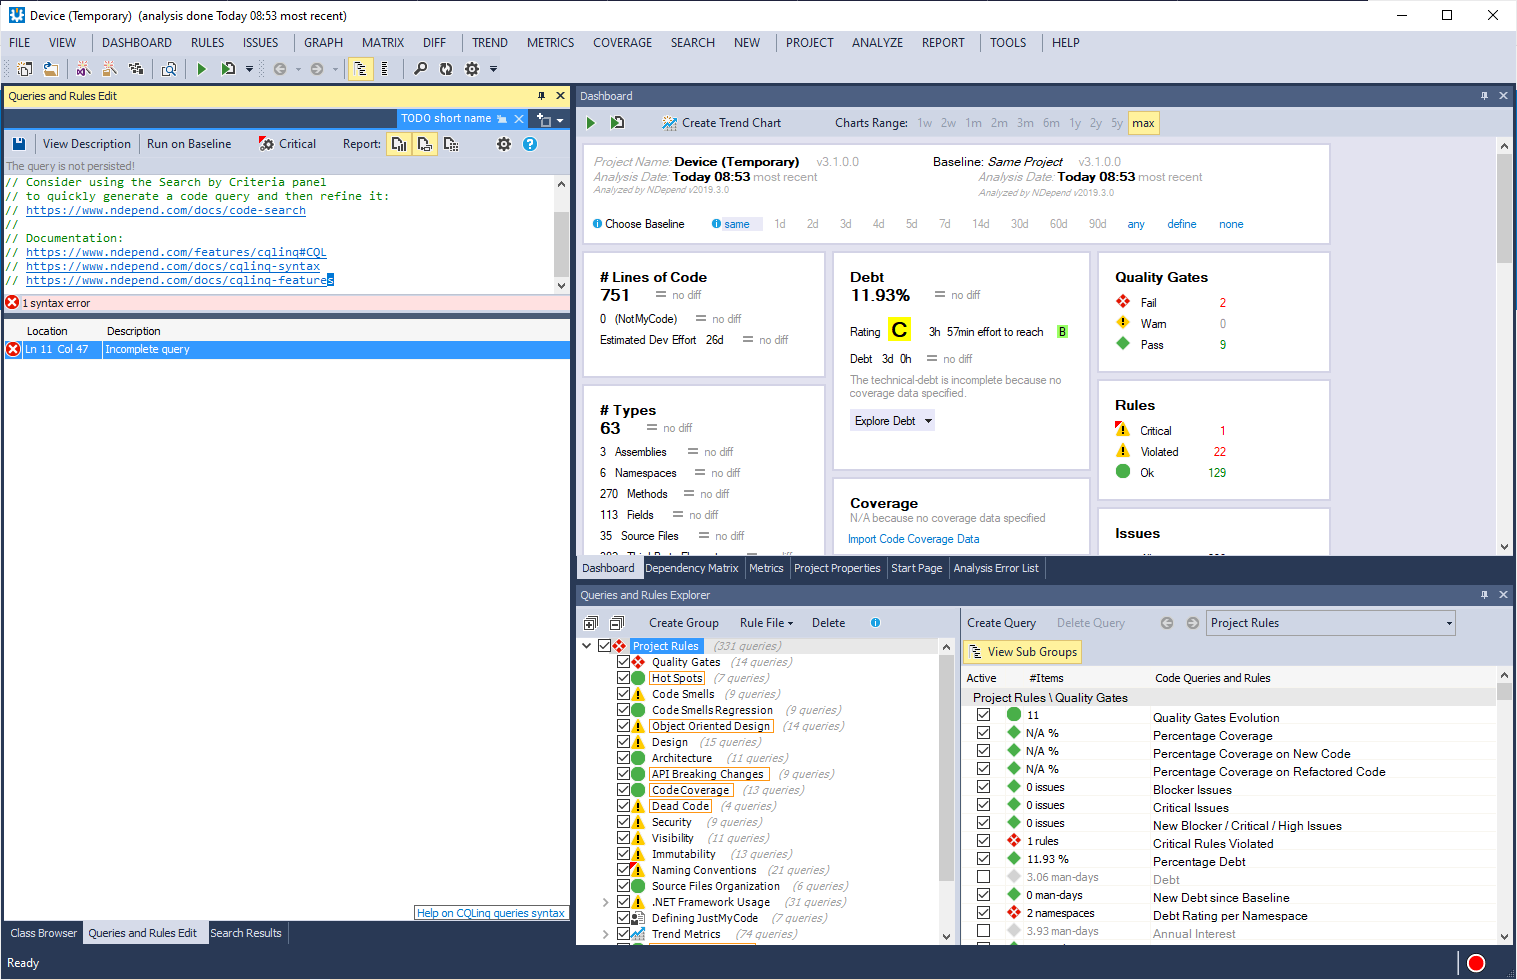
NDepend doesn’t just analyze your code at this point. It also measures the change in the quality of your code over time. It gives you graphs to measure this.
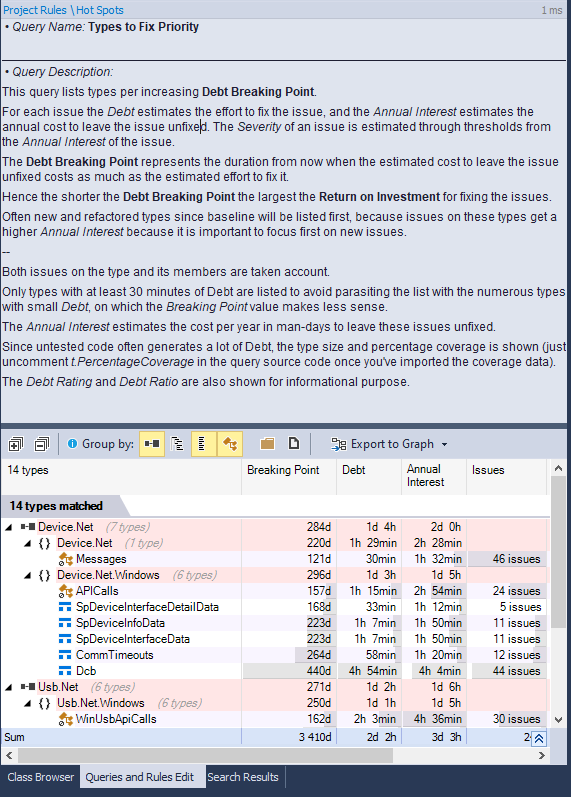
It has queries that do things like estimate which types would be the best refactor based on their technical debt.
NDepend can be a bit daunting at first. It is a sophisticated tool, and I’ve barely scratched the surface of what it can do. This tool requires some initial investment to understand and prepare in your solution. However, for large codebases, this gives insight that other tools may not provide.
Conclusion
Improving C# codebases over time is a necessary part of software development, and it is possible to do this even when codebases are already bloated. Using the best of breed tools help along the way, and the starting point is an understanding of what is wrong with the codebase. It helps to make informed and measured decisions about what to refactor to have the most impact. No one tool has everything, so a combination of tools is best. More tools are mentioned in the next part, with more depth on how they are used.